What Are Bins in Histograms: A Simple Explanation

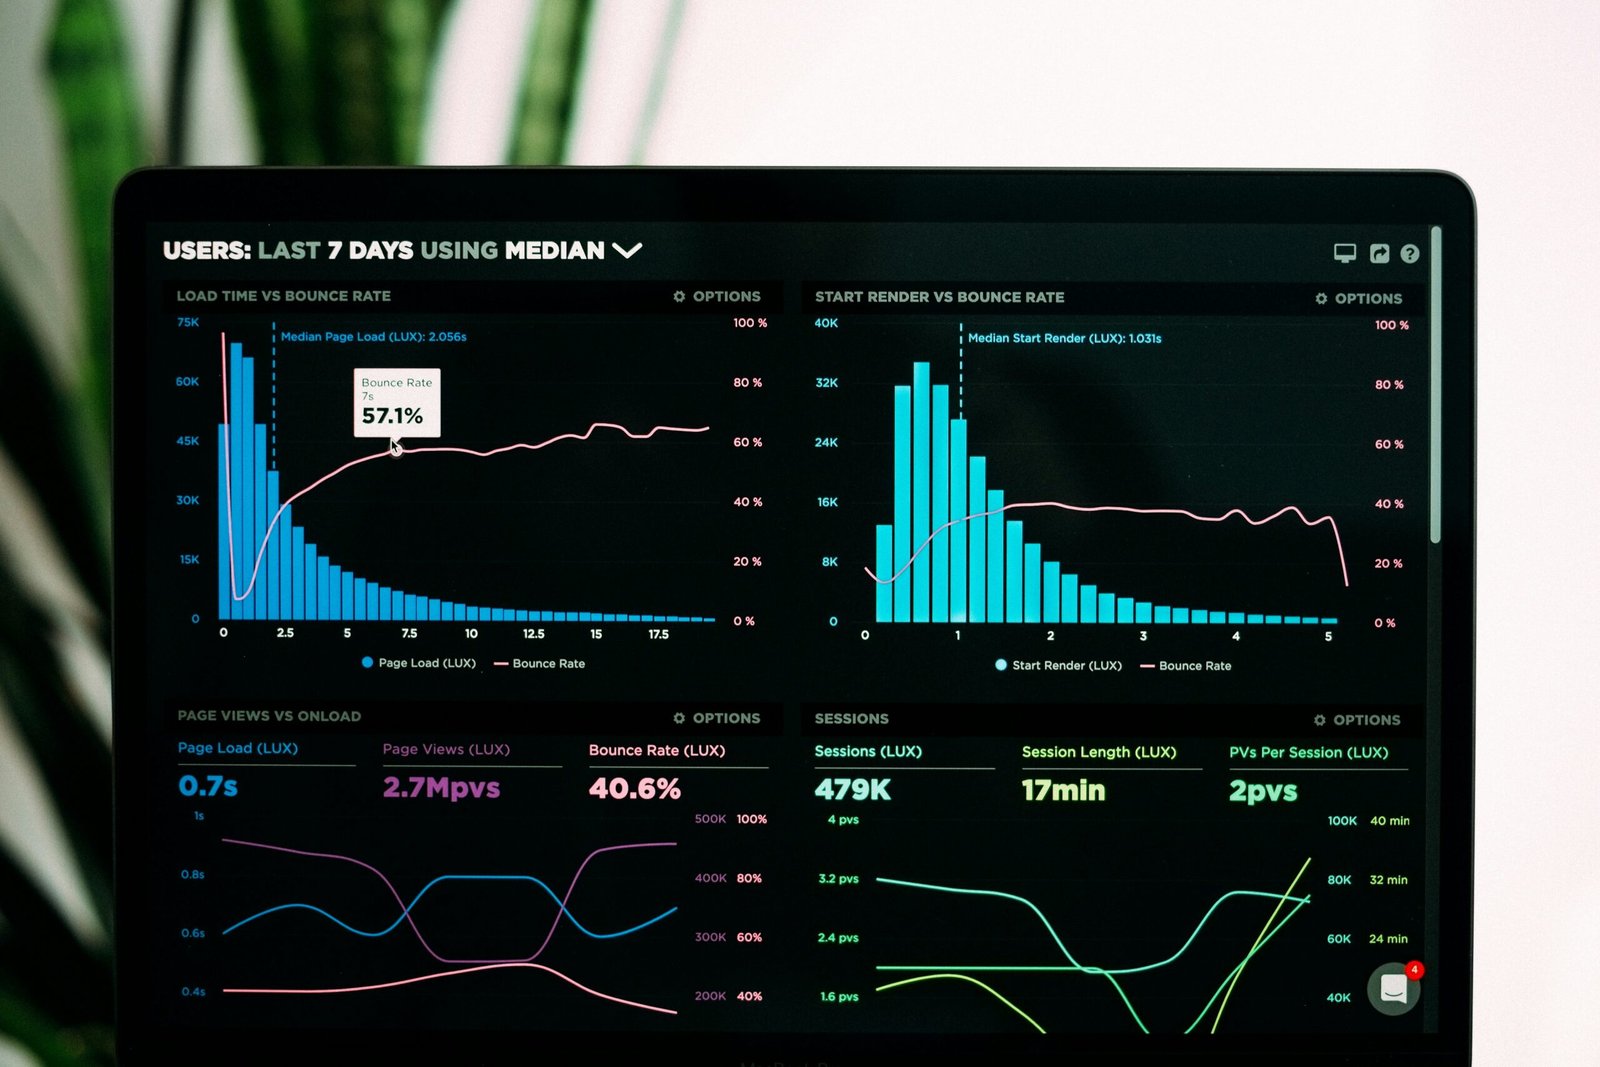
graphs of performance analytics on a laptop screen

Introduction to Histograms Histograms are fundamental tools in data visualization, widely utilized to represent the distribution of numerical data. They provide a visual summary that makes it easier to understand large datasets by displaying the frequency of data points within specified ranges. This graphical representation is particularly useful in identifying patterns, trends, and anomalies within … Read more
Data Visualization with Pandas using Matplotlib

Data visualization is a critical skill for anyone working with data. It allows you to convey complex information quickly and effectively. Pandas, a powerful data manipulation library in Python, offers robust capabilities for data visualization. This blog will walk you through the essential aspects of data visualization with Pandas using Matplotlib, providing detailed explanations and … Read more